Copyright © 2026 LOOP All Rights Reserved.
Data Visualization with Python and Matplotlib


Course Description
More and more people are realising the vast benefits and uses of analysing big data. However, the majority of people lack the skills and the time needed to understand this data in its original form. That's where data visualisation comes in; creating easy to read, simple to understand graphs, charts and other visual representations of data. Python 3 and Matplotlib are the most easily accessible and efficient to use programs to do just this.
Python Data Visualisation made easy.
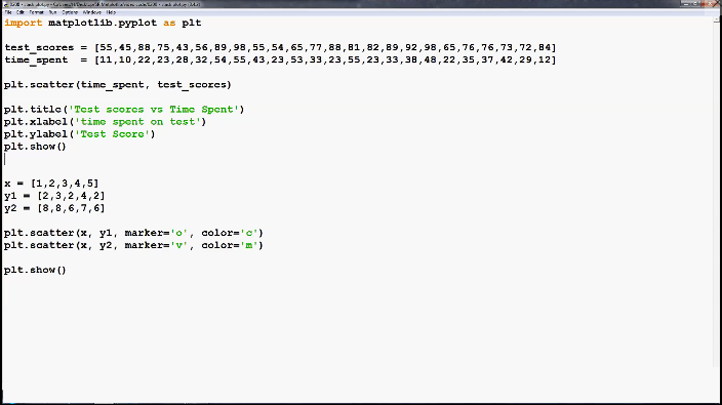
- Visualise multiple forms of 2D and 3D graphs; line graphs, scatter plots, bar charts, etc.
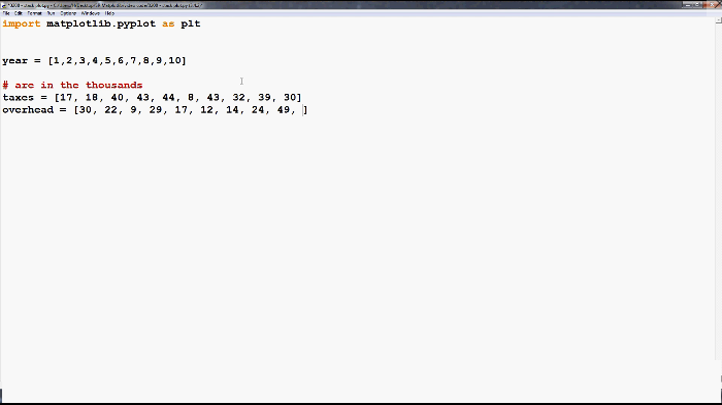
- Load and organise data from various sources for visualisation
- Create and customise live graphs
- Add finesse and style to make your graphs visually appealing
Course Objectives
1. Understanding Matplotlib and getting set up
2. Learning the different types of basic Matplotlib charts
3. Mastering the basic customization options for Matplotlib
4. Customizing ticks, add/remove & customize spines, styles with Matplotlib
Related Courses
Learn Google's Newest Programming Languages
SGD $50.00
Course Description
There are an endless number of programming languages out there, and new ones are added on an almost daily basis. To keep on top of the game and broaden your skill set, picking up a few of these new languages never hurts. Google Go (golang) is the programming language created by one of the largest technology names in the world – Google – so having Go in your arsenal is a surefire way to add to your coding credentials. This course will teach you everything you need to know about Go.Hands on programming training with Google's Programming Language. - Learn Go fundamentals and apply them in real world scenarios- Get to grip with advanced features like Go Language and Concurrency- Understand and develop your knowledge of programming fundamentals- Build up a knowledge foundation for more advanced programming languages
Read more...

1st Step to Mastering Perl Programming for Beginners
SGD $79.00
Course Description
The world of programming has become almost saturated with different languages, all created for different purposes but developed for use in multiple applications. For those just delving into the world of programming, this can be a little overwhelming. Luckily, there are plenty of languages that are simple to learn, highly versatile to use, and make a great starting point for gaining fluency in the coding universe. Perl is one of those languages, and this course will teach you everything you need to know.Perfect Perl the Easy Way- Work with different data types including strings, numbers, variables and user input- Create and use array, subroutines, hashes, and regular expressions in Perl applications- Gain a conceptual understanding and practical skills to construct your own levels- Become competent with the Perl language family and its use in various applications
Read more...
Learn Java Programming From Scratch
SGD $79.00
Course Description
Java is a general-purpose computer programming language that is concurrent, class-based, object-oriented, and specifically designed to have as few implementation dependencies as possible. It is intended to let application developers "write once, run anywhere" (WORA), meaning that compiled Java code can run on all platforms that support Java without the need for recompilation. Java applications are typically compiled to bytecode that can run on any Java virtual machine (JVM) regardless of computer architecture. As of 2016, Java is one of the most popular programming languages in use, particularly for client-server web applications, with a reported 9 million developers.Learn the grandfather of programming languages today!- Learn about the basics of Java programming language - Move on to the intermediate level of Java programming language - Know how to develop your own application using Java- Discover the advantages of knowing Java programming language
Read more...
Content
Course Introduction
Different types of basic Matplotlib charts
Preview Available
Basic Customization Options
Preview Available
Advanced Customization Options
Geographical Plotting with Basemap
3D graphing
Course Conclusion
Data Visualization with Python and Matplotlib
- Duration 7 hr 4 mins
- Skill level All Levels
- Languages English
- Tag(s) Programming Language Development
Convince your boss email
This site is best viewed using the latest versions of Google Chrome, Apple Safari, Mozilla FireFox, Microsoft Internet Explorer 11 and Edge which supports HTML5/Webkit technologies.