Copyright © 2026 LOOP All Rights Reserved.
 >
Available Courses >
Available Courses
>
Available Courses >
Available Courses 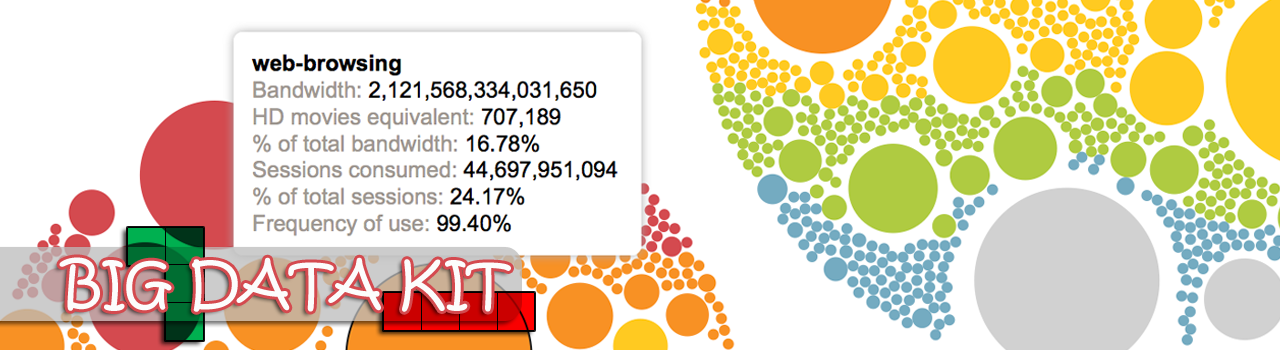


Big data is a term for data sets that are so large or complex that traditional data processing applications are inadequate to deal with them. Challenges include analysis, capture, data curation, search, sharing, storage, transfer, visualization, querying, updating and information privacy. The term "big data" often refers simply to the use of predictive analytics, user behavior analytics, or certain other advanced data analytics methods that extract value from data, and seldom to a particular size of data set.
Learning about Big Data Analytics can give students :

1st Step to DATA ANALYSIS WITH PYTHON AND PANDAS
Preview Available
Python programmers are some of the most sought-after employees in the tech world, and Python itself is fast becoming one of the most popular programming languages. One of the best applications of Python however is data analysis; which also happens to be something that employers can't get enough of. Gaining skills in one or the other is a guaranteed way to boost your employability – but put the two together and you'll be unstoppable!With this course, you will enable yourself to learn perform data analysis with python using the pandas library understand some of the basic concepts of data analysis, have used n-dimensional arrays in NumPy as well as the pandas Series and Data Frames to analyze data. Become an expert data analyst with Python made simple- Learn efficient python data analysis- Manipulate data sets quickly and easily- Master python data mining- Gain a skillset in Python that can be used for various other applications.
Read More...
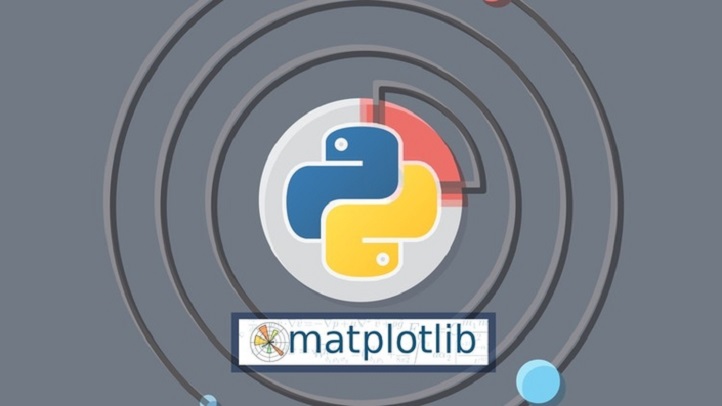
Data Visualization with Python and Matplotlib
Preview Available
More and more people are realising the vast benefits and uses of analysing big data. However, the majority of people lack the skills and the time needed to understand this data in its original form. That's where data visualisation comes in; creating easy to read, simple to understand graphs, charts and other visual representations of data. Python 3 and Matplotlib are the most easily accessible and efficient to use programs to do just this. Python Data Visualisation made easy. - Visualise multiple forms of 2D and 3D graphs; line graphs, scatter plots, bar charts, etc. - Load and organise data from various sources for visualisation - Create and customise live graphs - Add finesse and style to make your graphs visually appealing
Read More...