
Copyright © 2024 LOOP All Rights Reserved.
 >
Search > Visual >
Search > Visual
>
Search > Visual >
Search > Visual 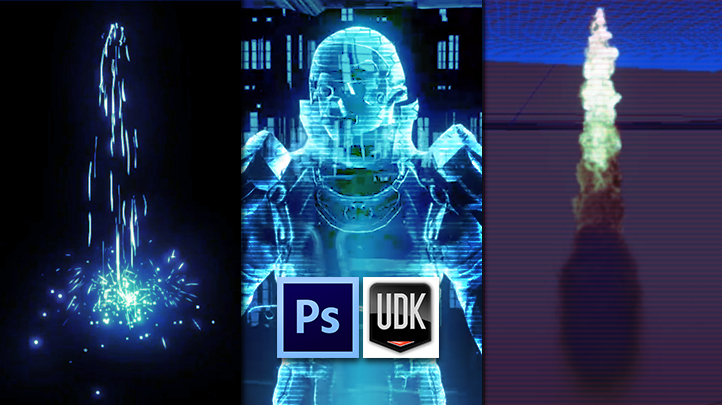
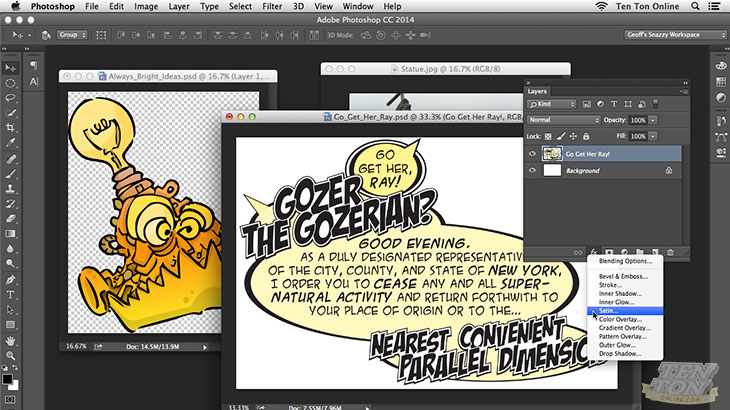
Mastering Digital Design - An Introduction to Visual FX for Games with UDK
SGD $189.00
This course is intended for those with a more comfortable understanding of the Unreal Engine who have an interest in creating Particle FX or Visual FX. In this course, we take you through the process of setting up a complex particle system that warps a character in through a teleportation device, as well as an amazing look at "phasing" the character in to view! We'll look at creating the holographic projections you see in the scene, adding texture and distortion to the sequence, and then wrap up the series with an in-depth look at setting up a basic render and animating the camera and lights so that you can make your very own cut-scenes and cinematics! Learn tips and tricks of creating dynamic animation and games design. - Know about the different branches in animation - Learn about what goes into making a successful animation - Understand better about the designing process with this course - Be able to create your own monsters and creatures at the end of this course
Read More...
Data Visualization with Python and Matplotlib
SGD $79.00
More and more people are realising the vast benefits and uses of analysing big data. However, the majority of people lack the skills and the time needed to understand this data in its original form. That's where data visualisation comes in; creating easy to read, simple to understand graphs, charts and other visual representations of data. Python 3 and Matplotlib are the most easily accessible and efficient to use programs to do just this. Python Data Visualisation made easy. - Visualise multiple forms of 2D and 3D graphs; line graphs, scatter plots, bar charts, etc. - Load and organise data from various sources for visualisation - Create and customise live graphs - Add finesse and style to make your graphs visually appealing
Read More...